Software roadmap
Whilst the title software roadmap might not be the most attention-grabbing, we’re rather pleased about how our software is coming along!
We continually look to develop our software to make it better, whether it’s making existing things work better or bringing online new features and functionality.
This month will see three new elements added or updated in the reporting portal.
- Ability to download PDF, Excel, PowerPoint, Word and other reports directly from the portal
- Headlines heatmap
- Comparison report updates and additions.
Download reports
Following the improvements based on our software roadmap, you’ll be able to download and access all your reports directly within the reporting portal itself. We’re adding functionality that will allow us to push Executive Summaries, Executive Presentations, and Excel Headlines all into the portal. So, along with the Workbooks and Comment Reports, everything is in one place.
Whilst in itself this is fairly straightforward, the neat touch here is that you will be able to give access to these reports to individuals or groups, making managing access and distribution of all reports easy, simple and straightforward.
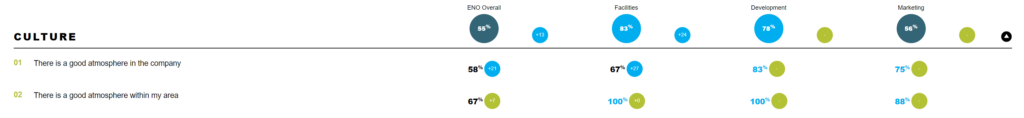
Headlines heatmap
A number of clients have asked for a version of the headlines that just focus on the overall score for a question (be it a % positive, Average, Count etc.). Well, you asked and we’ve delivered.
The well-loved and detailed Headlines (where you get the breakdown across the scale for each question) remain. The new version gives you just the overall score for each question, giving you an easy-to-read and understandable Heatmap for all questions by all demographics!
Comparison reports
Some of you might be unfamiliar with our comparison reports. They really are a wonderful thing! They bring together the design, look and layout of our Workbooks with the combination of data seen in our Headlines.
In short, you can easily and quickly place groups of data next to each other, making it easy to compare groups and spot differences.
We’ve now added additional functionality to the front page of the reports, making the data even clearer and easier to understand. You can now pull data across from the workbooks to visualize your data even more succinctly.
Even more features are on the horizon and we’ll keep you posted as they come online.
For more information on our software roadmap, or to discuss any of our bespoke employee survey services offering employee insights, including staff surveys, 360 feedback surveys and pulse surveys, contact the team at The Survey Initiative.